This transcript has been editing for length and clarity. To find out more about what K-Lytics can do for authors (and for free basic reports) head to this special page for Reedsy Live viewers.
Part of the material was presented at 20Books Vegas, where I met with Ricardo from Reedsy. By and large, we're going to cover three big topics:
- Market forces. Excuse me for such a fancy term, it's going to be simple, no worries.
- Latest market numbers. What's going on in the publishing world out there and
- Opportunities and trends across genres.
I hope you're as excited as I am. Usually, I get this type of reaction when I mentioned the very word data. So don't worry, I going to make it easy, very palatable and hopefully also a little bit of fun. All right. So let's dive into our first agenda point.
Harnessing Market Forces
And many of you, especially if you whatever have not studied economics or something are going to say, "Harness what?" And it's basically very, very easy. My best example of this whole matter is when I was a young boy in the 80s and the thing you had to have at the time was a Rubik's Cube. It was a toy everybody had to have and everybody had it except me. So my mother and I spent like two weeks running around toy shops trying to find this very item and I wasn't able to get it. So very early in my life, I was exposed to these forces of supply and demand, if you will.
I noticed there are trends and you don't want to be on the wrong side of supply and demand. Trends come and go and there are huge surges of demand that are satisfied by certain authors who write in certain genres. Let's take an example from this year? Very simple.
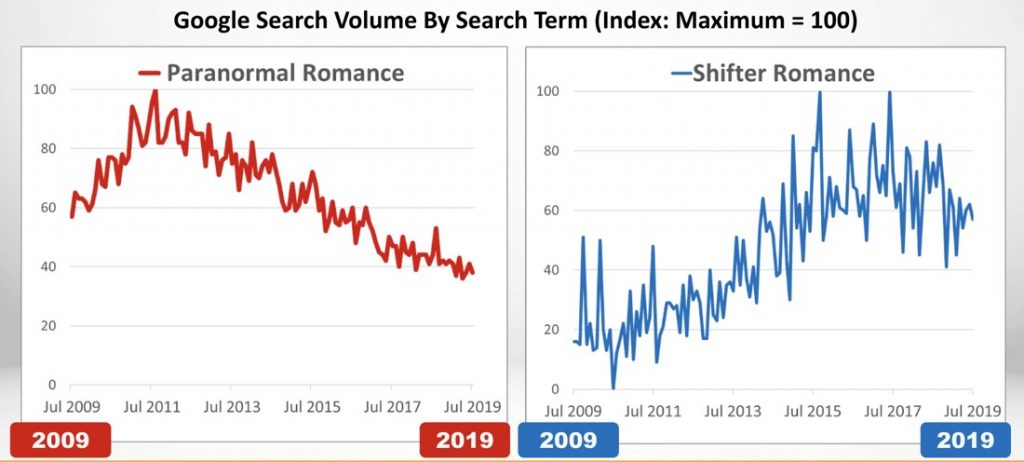
From 2009 to 2019: a 10 year period showing the Google search interest for the paranormal romance search term. There was a huge peak back in 2011 and then it trailed off.
Does that mean that overall interest for paranormal romance is dying off? No, it certainly doesn't (because vampires never die as we know). And there are certain other sub-genres that — although in absolute terms may be much lower in search volume — showed different patterns. As an arbitrary example, you see shifter romance (a sub-genre within paranormal romance) taking almost an opposite course, having then a much later peak.
So it's very key as an entrepreneur — somebody who wants to reach an audience — to gauge what the audience is doing. Where the audience is going, taste-wise? This is what we are trying to do when we talk about harnessing market forces.
I'll give you another example to expand a bit around this concept. And this is about bringing supply into the equation.
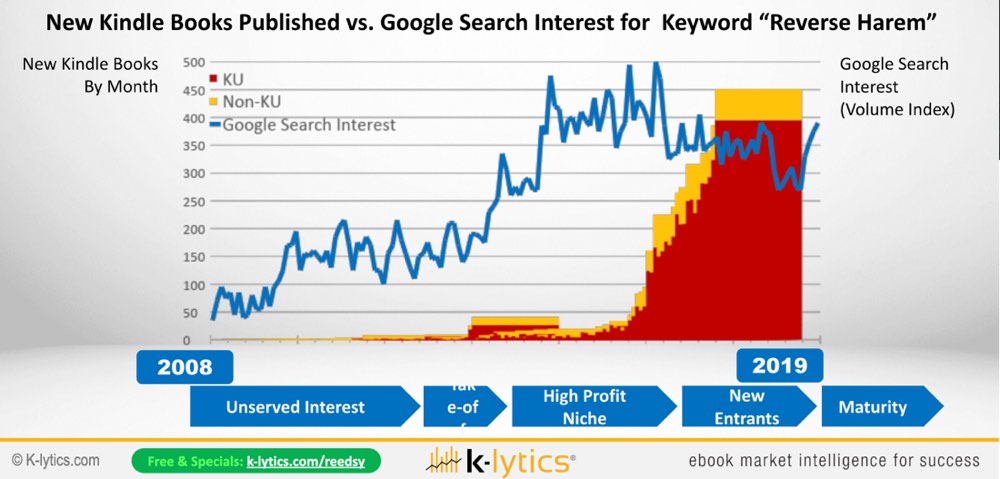
The blue line is something that started popping up a couple of years back in Facebook groups. The "reverse harem" genre or trope is where you have one heroine and a bunch of guys around. It can be sci-fi and fantasy, it can be romance, it can be erotica, can be LitRPG — many genres by now make use of this basic trope.
Why choose romance? Because the heroine doesn't choose and that's very important to the authors and the genre.
If you look from 2008 all the way up to now, you had a period of like unserved interest — the interest was not so much here in the Western book market as it was in Korean comics and Japanese manga where this trope was getting big. Then from 2014 to 2017, you had big hype and interest, but hardly anybody writing in the genre.
Those were like the super golden times. And what you see then here in red, in orange where the number of KU and non-KU books coming into the market every month. From 2018, the market started to flood with a supply of these books. So this is where the demand was met by a book supply. And I'm not saying that this is getting saturated, but you see how these two factors stopped playing together.
The leading authors in the genre then always, "Well, what is the next wave going to be?" And that's when you have to think almost like a movie producer: What is that next theme?
This is just a completely arbitrary example to illustrate this whole point of market forces where you have a supply of books and the demand for books. I'm not telling you what you should write but obviously, you want to be on one of these genres where the demand is growing and hopefully where the supply of books is not yet overly crowded.
The Big Picture
So what is the big picture right now? The latest data you get from the American Association of Publishers, the AAP is here. It's the traditional publisher's view of the book market — their total trade revenue over the last three years.
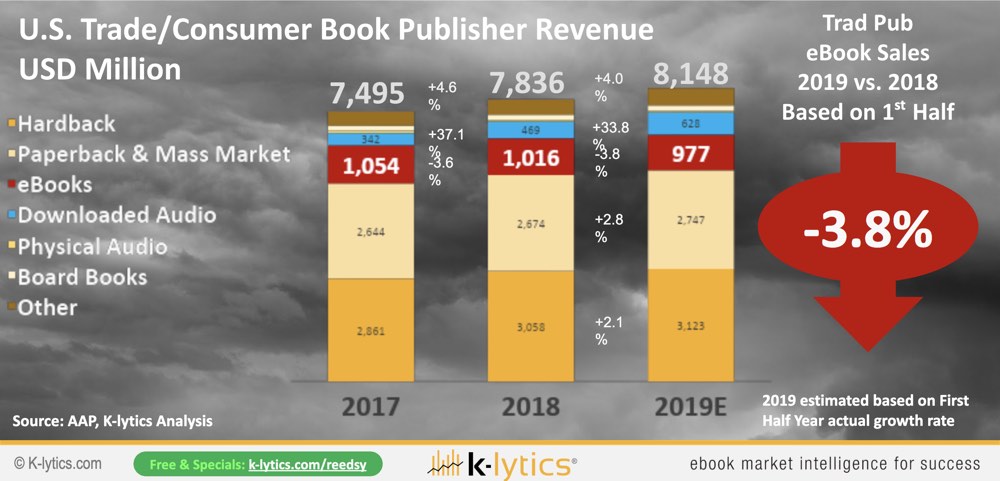
This is from 2017 t0 2019: first of all, good news for everybody in the book market. The market has grown more than 4% year-on-year. But if you go into the details, there are three major things you should take away.
First: the market is up! Next to the growth, you see an orange and light orange area that represents print books: hardbacks, paperbacks, and mass market. Out of these $8.1 billion generated in the U.S. by traditional publishers in trade revenues with books, the bulk of the money they earn comes from paperback and hardback.
Second: remember these are numbers released by big publishers. You will sometimes read in the newspapers or in the media that eBooks are shrinking. Well, those are their numbers. They don't care so much about eBooks and they obviously overprice them so as not to cannibalize that big yellow area that you see in this graph.
Third: audiobooks! There's one blue area and we're going to dive into that a little more in detail, which is the blue area — audiobooks. It has been growing two years in a row with more than 30% per annum.
Traditional publishers have seen a shrinkage in the market for ebooks. But the big problem with these numbers is that they are provided by a panel of some 2,000 traditional publishers in the U.S. There are a few publishers not in the panel: crucially, Amazon.
Guess what? Amazon, the rumor goes, holds more than 85% of the ebook market in the U.S.
So these red numbers are by no means representative. Just look at one part of the ebook market: the Kindle Select global fund. These are all the royalties paid to Kindle Unlimited authors.
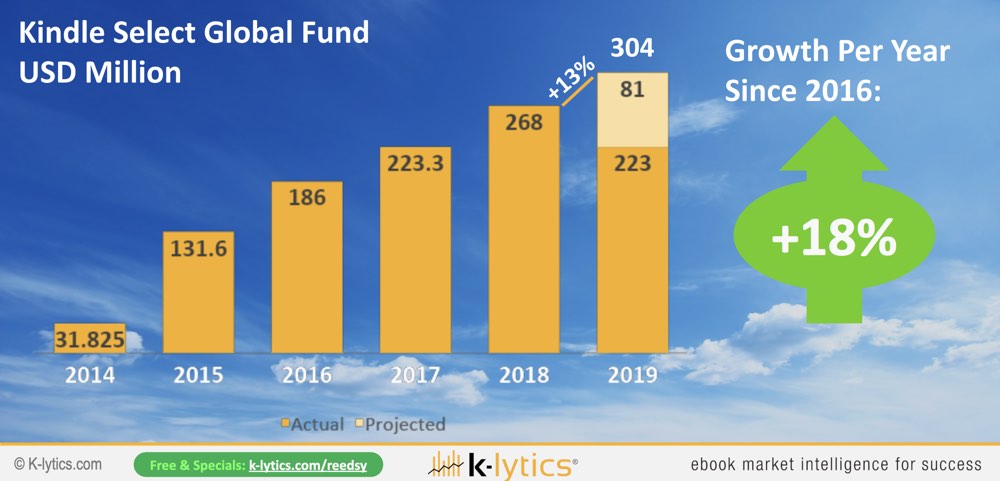
If you add all these numbers together, first thing you note is that, by I think July this year, 1 billion US dollars were paid to Amazon Kindle Unlimited authors. There's a year-on-year growth of 18% since 2016. This year it's going to grow. We predict it to be $304 million and that is pretty significant. So take this as an alternative view on the ebook market.
Kindle Unlimited pay-per-page rate
Don't get too deep into mathematics, but as a Kindle Unlimited author, you are paid by the number of pages read, which is expressed in the Kindle Edition Normalised Page Count.
Everybody in self-publishing Facebook groups have been going, "Oh, it's been growing," or "It's been going up and down." Well, the fact of the matter is that, over the last few years, it's been fairly consistent. If you were to average it, you're earning about $4.65 per thousand pages read. This gives you a bit of a picture of what the value of, say, a 300-page book is in terms of royalties. The point is if you the total size of the pie is $300 million this year and you know what the pages read are and what the price is, you can compute the number of ebook pages read every year ever since that scheme was introduced.
So, we were able to calculate about a 19% growth in the number of pages read since 2016. Just imagine: 65 billion book pages read 2019 in Kindle Unlimited, which is fairly significant.
Kindle Unlimited market share
Now the big question is how much of a market does that Kindle Unlimited represent? Well, the overall supply of books in Kindle Unlimited is about a third of Amazon's overall English-language book market of six million books. A third of those books supply Kindle Unlimited. Because these titles tend to rank higher, we computed that out of that 19% growth:
- about 11.5% was basically generated by Kindle Unlimited gaining share and
- another estimated 7.5% was generated out of underlying ebook growth.
We see a different picture of eBooks when we look at the Kindle platform and then at Kindle Unlimited.
Another striking data point. We calculated the share of KU royalties that went to the top 100 bestseller lists across 30 main categories back in 2016 and then in 2019. And guess what? The share of Kindle Unlimited books has grown from 45% to more than 60% this year. As always, the story changes by genre.
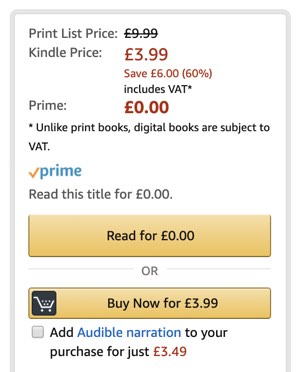
There's a conspiracy theory that Amazon manipulates the algorithms to prefer Kindle Unlimited books. Although we don't know the details of the algorithm, our very strong hypothesis is that this is not true. The reason why Kindle Unlimited is basically earning share is a matter of conversion: gives readers the option to either pay an expensive price or read it for free on KU. From a psychological point of view, from a buyer's point of view, a Kindle download, Kindle Unlimited download is always a free book. Yes, you paid the subscription, but once you're on the site it's like a free download, psychologically speaking.
However, both purchases and downloads drive the sales rank. So it's almost like bait. The algorithm doesn't prefer KU. The mechanics of Kindle Unlimited means that it performs like a free download (from a conversion point of view) so it results in more downloads. These downloads, in turn, drive up the sales ranks which in turn generates more traffic for KU.
Inadvertently, it may be baked into the algorithm that over time Kindle Unlimited gains market share. This is what that market share looks like between the biggest genres:
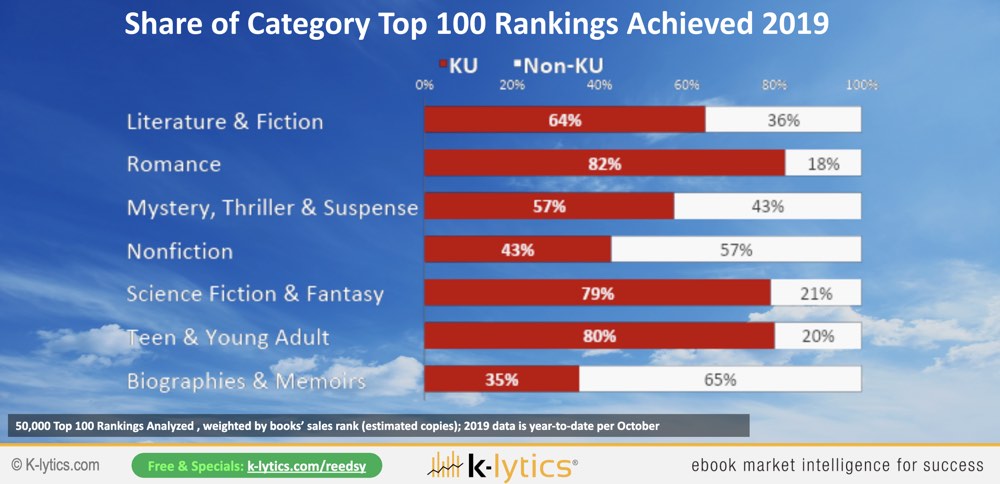
In romance, 80 titles out of the top 100 at any point in time are Kindle Unlimited books. If you go to mystery, thriller, suspense — which is heavily contested by traditional publishers — half of the books approximately are Kindle Unlimited. You have also a very high share of KU in sci-fi and fantasy as well as teen and young adult. This gives you a little bit of a perspective of what is happening overall in the market.
The question is well, how do you best participate? Next to the supply and demand equation, there are certain data points from our work that we do for our members. Looking at our monthly category performance database, we can hopefully extract a couple of insights that you guys might find useful and actionable going forward.
The money is at the top
That's the mountain we have to climb is the fact that there are more than six million English language titles in the Kindle store. The books with the top 50,000 rank positions probably drive almost close to 90% of all the money being spent on the store.
Let's look at the genres that made up those 50,000 top titles of the last three years which achieved the top 100 rankings.
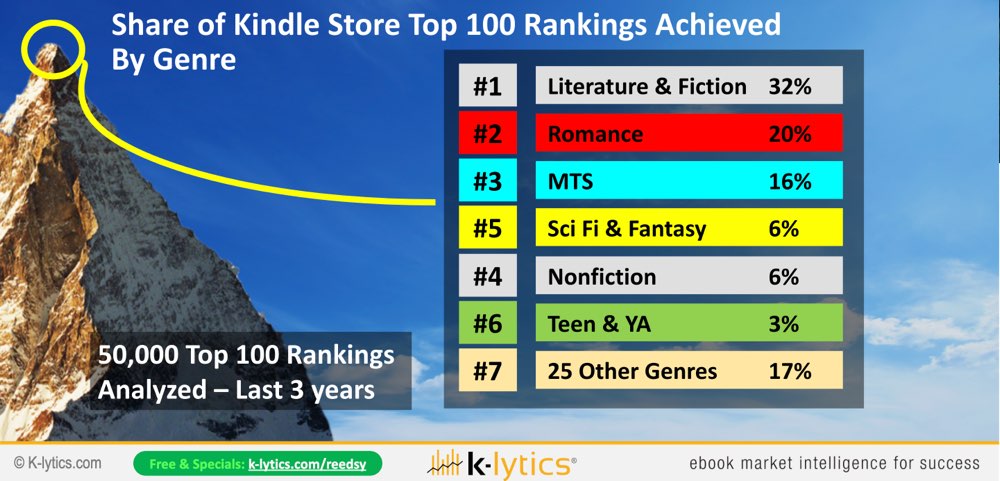
So first the umbrella category, Literature and Fiction: 32% which is pretty non-telling because it is a big umbrella category in which almost every book is categorized.
- Romance basically leads the market on the Kindle platform — 20%
- Mystery, Thriller, Suspense (MTS) — 16%
- Sci-fi and Fantasy — 6%
- Nonfiction — 6%
- Then Teen and Young Adult — 3%
- Then you get 25 other genres splitting the remaining 17%
If you're in Teen or Young Adult, you're serving all these genres but confined to a certain target age group.
Out of all these books that make it all the way to the top of the mountain, what type of authors are they? We went through more than 8,000 - 10,000 published titles, discerning whether they were published by a Big Five imprint, an Amazon imprint, a smaller publisher/indie publisher.
- Indies – 38%
- Amazon Imprints – 26%
- Big 5 — 20%
- Other — 16%
What we find is that, out of these top rankings, the lead segment is now Indie authors on Amazon Kindle. Followed very strongly by Amazon imprints, with its big imprints such as Thomas & Mercer and Montlake Romance, you name them. Then you have the Big Five and all their hundreds of imprints. And then other publishers.
I think that is really an amazing achievement. And when Ricardo from Reedsy and I were at Vegas at the Big Indie Conference, you could really sense the energy in the room that is reflecting these numbers. There is ample opportunity out there. As always the story varies by genre:
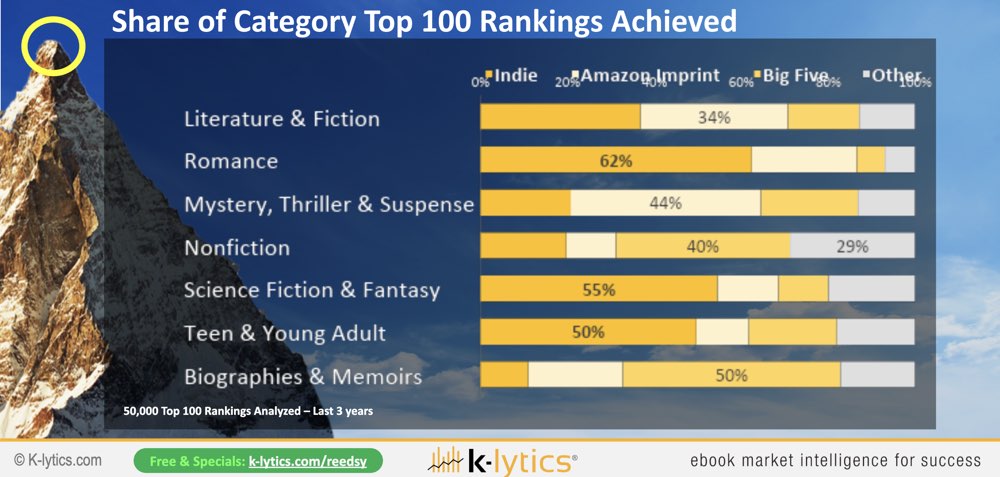
- We have very strong indie performances in Romance: extremely strong.
- Then MTS a bit more contested by Amazon imprints.
- Nonfiction sees the balance tip towards the traditional Big Fives.
- Sci-fi, Fantasy, Teen and Young Adult, clearly the lead position has held by indie authors.
I think that is really a fantastic achievement if you look at more than half of the top bestseller list at any point in time being populated by Indies.
Series vs Standalones
The big question I often get is, "Hey, what about series versus non-series?" Well, we also have data on this one!
So for example, all series gaining share. When we looked at the compound data across all the 30 categories, we could see that the share of KU revenue taken by books in a series went from 25% in 2016 to 27% in 2019. It may not look like a big shift at first, but if you have Pepsi gaining two percentage points share over Coca-Cola, that's a big thing in the consumer market.
So about even if you say, "Well, that's not so significant," there are important insights when you look at the genres.
One: In certain genres — such as Romance, MTS, and Sci-Fi and Fantasy — anywhere from 40% to 55% of the top 100 best seller rankings achieved are by now achieved by series. One of the main factors behind this that many of these rankings are achieved by way of advertising. And if you advertise one book, you automatically advertise the whole series. In many cases, the return on marketing investment and the build-up of reader loyalty is a major factor in determining why series — in the long run — seem to perform so well.
Prices
Without going into a lot of detail, there are a few things to know about prices.
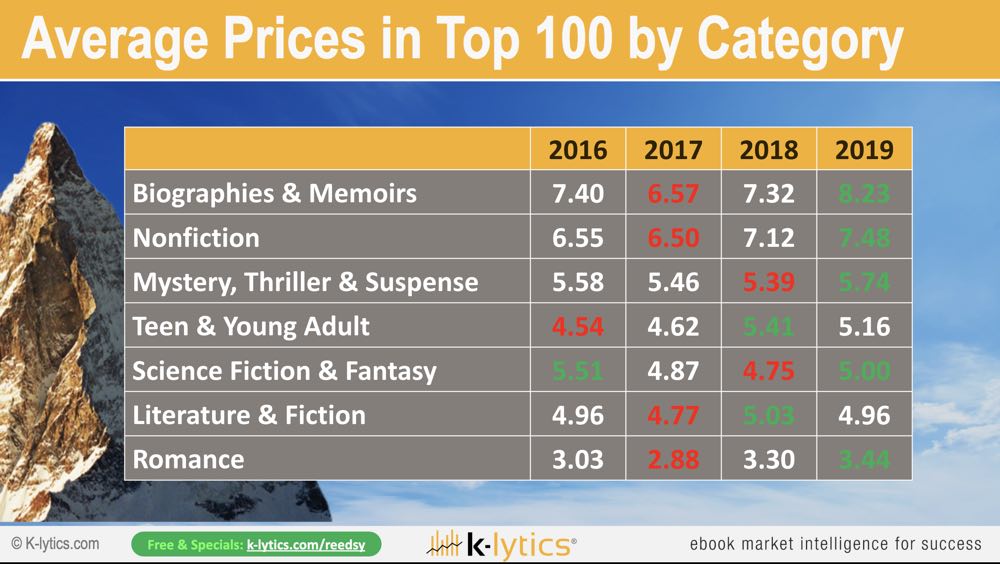
The first thing you need to take away, price points are different by genre. That's rule number one. The specific thing you need to take away from this chart are the red and green numbers. The red numbers tend to be the lower average prices, which were more in the year 2017 across the majority of genres. And ever since then we've seen basically a re-increase of prices all the way up to this year. I think this is good news for all authors and publishers involved.
Second point: these averages, so obviously don't price your book at such odd prices. What you're more interested in are the most frequent price points that you see in certain genres.
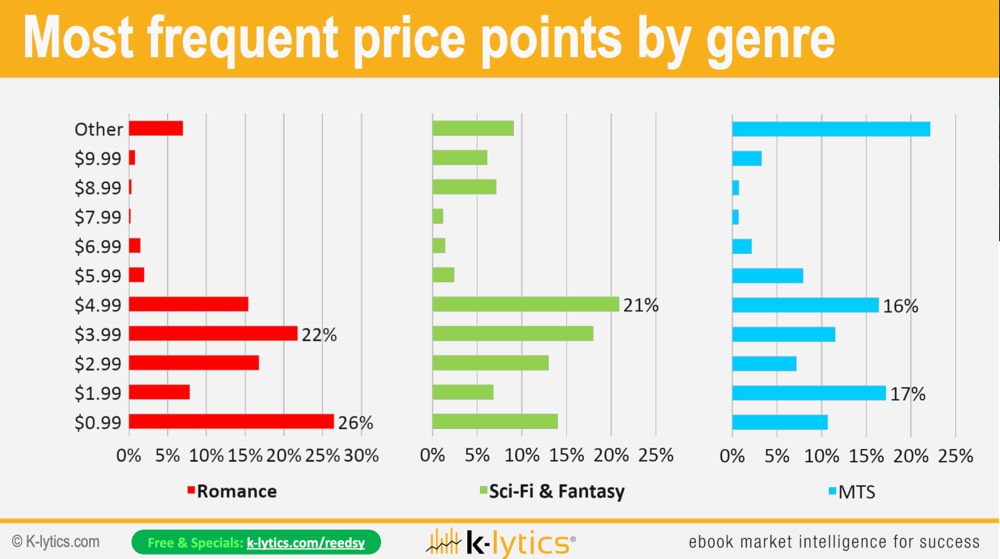
As always, the genres vary. The most frequent price point in Romance would be 99c and $3.99. By contrast, the most frequent Sci-Fi price point — with 21% of the books — is $4.99. Then with MTS, you see a larger distribution: some have higher prices, as commanded by the traditional publishers contesting in the segment. But you see also the $1.99 price point pretty popular. With our K-Lytics members, we go into individual genres in our in-depth research reports — looking not just at the most frequent prize points, but the highest yielding price points, right? Your total royalty is the number of books sold multiplied by the price (if you're non-KU, as an example).
So the highest yielding price can also differ from the most frequent but you can get a feel of where the genres are moving price-wise these days.
Formats
Earlier, we saw how in traditional publishing that the numbers for the different formats were changing — and how was audio growing.
What we did and what you can do yourself. Go to your category in bestseller lists, scroll down and click on "print bestsellers".
The irony is that not all "print bestsellers" are prints. So once you're there, click on romance — and you'll find that there are hardly any hardback or paperback in those top 100! So basically it is a cross-format list. Because it is not a print bestseller list, that allows us to look at the share of formats across the top 30 best sellers.
- When we compared the split between formats in 2017 and 2019, we can confirm the continued growth of both eBooks and audiobooks.
- Print is getting more and more squeezed in the middle.
Let's cut out the hardly selling nonfiction categories and just focus on the high selling categories: Romance, MTS, Literature and Fiction, Sci-Fi, Fantasy and Teens.
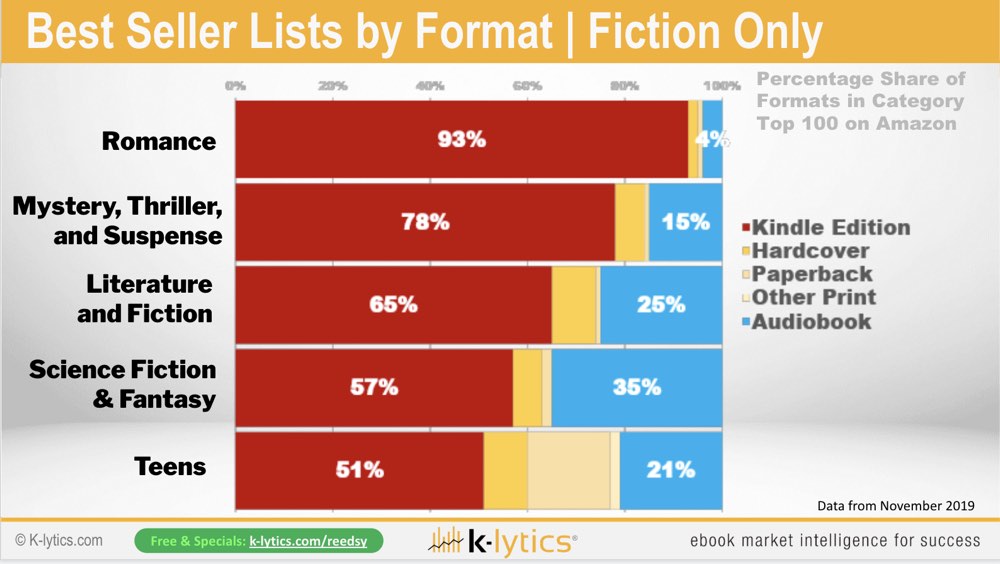
And I think that speaks itself: no comment. This is basically what the Amazon bestseller lists look like. If you put that together with also the share of Indies you have there, I think it clearly tells you which way to go.
Does that mean you shouldn't do print? Not necessarily. It just shows you where the bulk of the market is and where you need to focus if you are published on the Amazon platform.
We showed some initial data in Las Vegas concerning audiobooks. On top of ebook data, online audio format data is on its way to our members — to help them make more sense of that huge blue area that you just saw.
Genre Trends and Opportunities
We collect data for our members every month, and I extracted some of the interesting trends for you here. So, let's dive right into it.
If you work as an author and you work predominantly alone, then you know how your own books are doing — and you may want to infer certain trends. If you are a part of groups like the Reedsy Facebook group, you will often see people talk about certain trends. And that's really the thing to do as an Indie author: join forces with others to stay abreast of what's happening. Bu what can we add to the picture?
I try to bring the insights of working with thousands and thousands of books. So we monitor thousands and thousands of books to see that there is a whole universe of opportunities out there for you.
What you can do as an author with words is basically unlimited, like stars. But, we do know that some stars are a little bit brighter than other stars. And some stars are more populated than others. So basically, if you have two genre to choose from, you could argue that there is one that you might be more interested in writing in or putting your advertising money behind.
Our two biggest factors when we look at categories are Average Amazon Sales rank (how well the top 20 titles in that category doing, rank-wise) and competition (how many books are there in that category?)
Of course, there are misplaced books, what we call "category pollution." But the big picture is still fairly good across the board, especially if you look at how well all the romance category is doing as well as pockets of sci-fi and fantasy, et cetera.
Exploring the Spectrum
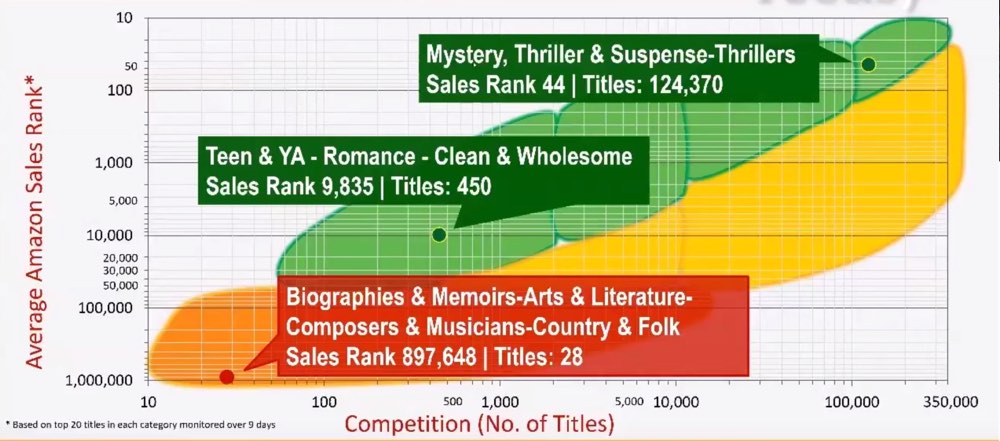
Let's first look at MTS — where the average sales rank across the top 100 over time, is 44 out of 6 million books. The sales are ultra-high in that category... but we also see that there are a hundred thousand titles in it!
A very new trend we see is Teen and Young Adult – Romance — Clean and Wholesome. Clean and Wholesome Romance has been a big thing over the last two years — but now it's going into a specific age group. The sales rank across the top 20 titles in this category was higher than 10,000 but at this point in time, there were only 450 English speaking titles in this category.
And if you want to write Biographies and Memoirs about arts, literature, composers, musicians, country and folk music, you're welcome to do so. There's zero competition (28 books only in the category) but also basically zero sales.
Why do these categories matter? It is both strategic and tactical. The categories do matter because when you enter a search into Amazon — they, first of all, will deliver a category-driven book purchasing experience. You will shop by category.
But more importantly, when users put in a search, the algorithm presents books based on that keyword — but it will also deliver books from the "same aisle in the supermarket" which are books from the relevant category. So for example, if you type in paranormal romance, most of the books displayed will also be in the paranormal romance category.
Romance
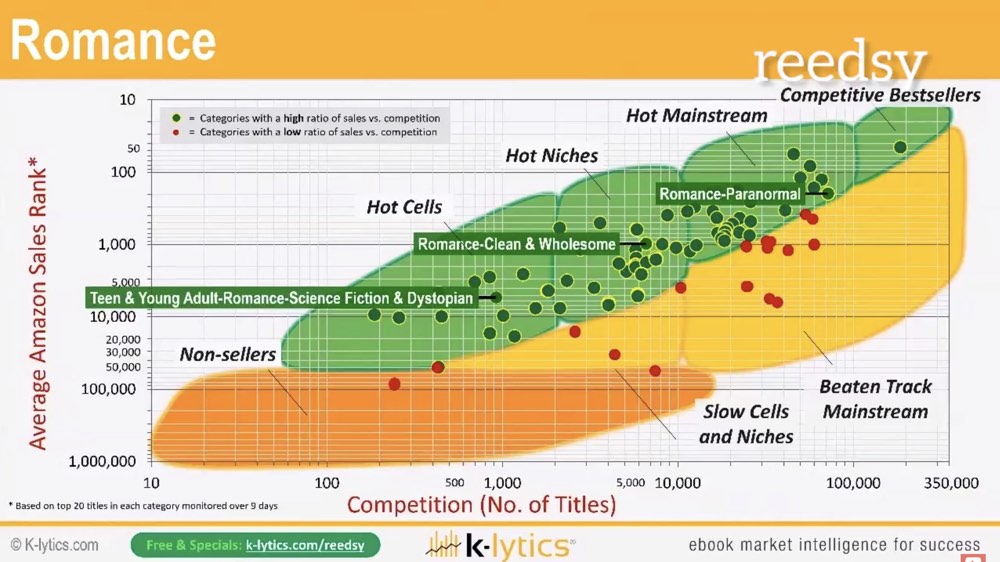
This chart shows the Romance genre's health — an excellent genre on Kindle.
- In the "hot mainstream" market you see a lot of sales on paranormal romance — a category that's also usually crowded. But if you have the advertising money, it may be exactly the right market to go into.
- In the middle ground — the "hot niches" — the Clean and Wholesome Romance we reported to our members over the last two years.
- And then if you go into Teen & Young Adults — Romance — Sci-fi & Dystopian. That's your typical Hunger Games genre. Despite the big hype, there is still fewer than a thousand English speaking titles in the category.
We also measure average sales ranks over time. Here is Paranormal Romance with a huge peak back in 2015, some fading interest, and then a bit of a renaissance here in 2019.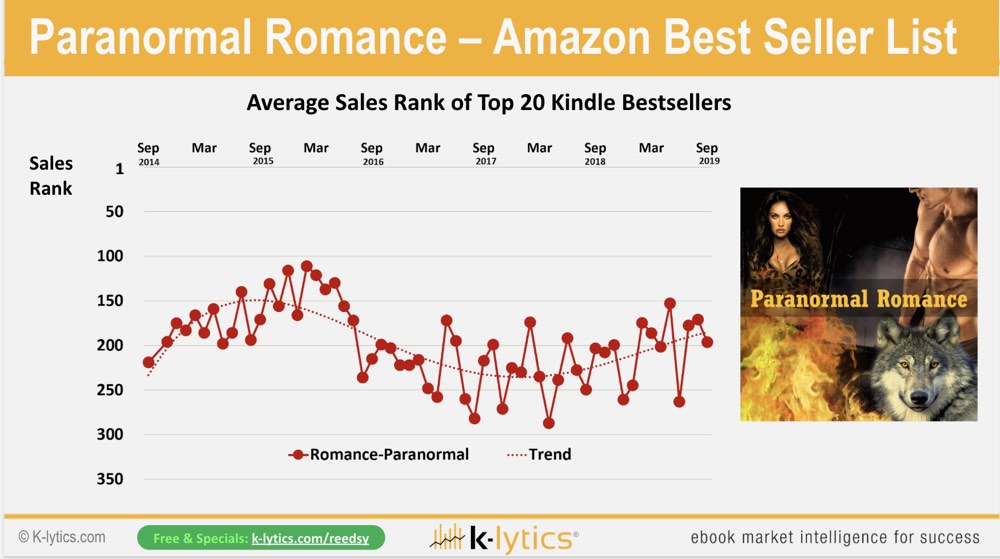
This resurgence is basically on the back of a big Indie author, Bella Forrest with her Harley Merlin series. She was already riding the first wave with Shades of Vampires.
We can also see other interesting trends over time. For example...
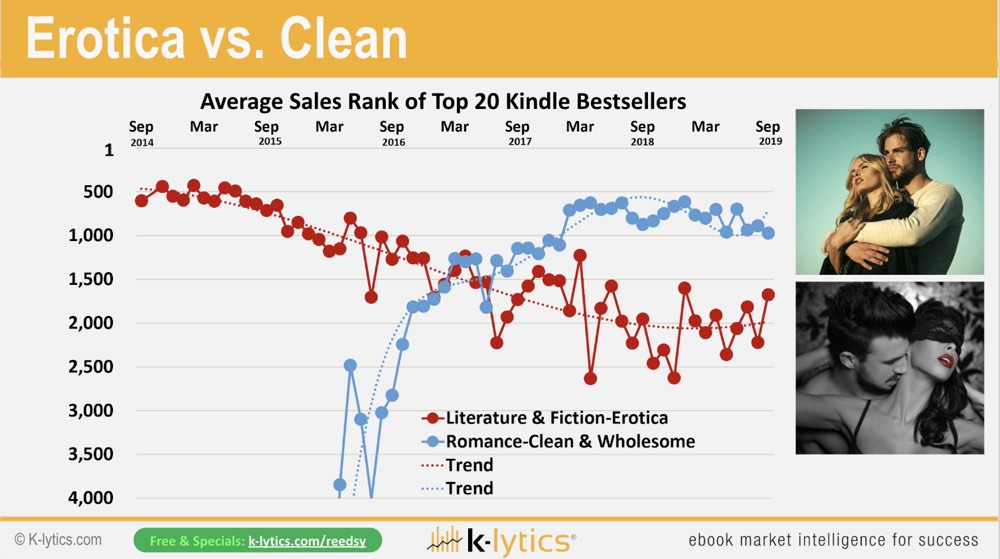
The red line is the last five years of Erotica sales in literature and fiction. And the blue line is the plain and wholesome category. You see while one was shooting up, the other goes down. Recently we saw a bit of a leveling off in both, with a bit of a comeback in erotica. Publishing erotica is highly restrictive on the advertising side of things, which was probably one of the reasons for the dip here in first supplies.
At this point in the presentation, Alex provided an analysis of a few other genres. We have not transcribed this portion of the presentation, but you can find them at the following sections of the video above:
- Mystery, Thriller & Suspense — 39:35
- Poetry — 42:50
- Science Fiction — 43:32
- Fantasy — 44:30
Beyond Categories
So I hope this gives you a bit of a feel of what the market currently — and of our research at K-Lytics. Obviously, it doesn't stop at categories, we try to look beyond categories. So what we can do is look beyond categories by basically digging into things like:
- "Well, give me all the female protagonists for thrillers."
- "Oh how about bad boy romance?"
- "How about literature role-playing games in literature?"
Even if there are no dedicated categories for it, we will look at the occurrence of certain words, say trigger words — I wouldn't call them key words — certain clues through the use of certain words that can give you, basically create whole virtual bestsellers for categories that do not exist. Then we can take it even further in our genre reports where we cover things like the top-selling tropes.
What should you take from that? First of all, I mean, you are creative people, so your first priority will always be on the writing. But then you're also business people as Indie authors. You are the publishers. You can use data for two major things. One is strategic: what shall I write? What direction should I go in my genre? You may even post a very strategic question. "I've been writing whatever romantic suspense for the past 10 years. I like romance but I want to do something else. Shall I go into sci-fi or into MTS?"
It can be tactical as well: "which 10 categories do I put my book into?" So you can use data for both of them. I want to encourage the business person in you to consider these things, because every Indie publisher is a publisher, and a publisher is a business. And in business, we work with market data to get a feel of what's happening.
Having said this, don't bend yourself. It's always very important to say at the end of these webinars because we hear a lot about "writing to market." And whether you are in it for the money or recognition, you want to reach an audience, right? So how do you do that? I personally think, first of all, it comes from the love you bring for a certain subject. If you don't love what you write, don't do it because it's not going to be sustainable.
You also need to have a good craft. You need to be a good writer and bring certain knowledge to your work. So there is no use telling you, "Hey, legal thrillers are a really good thing." If you don't love them, don't how to write in the style and don't have any knowledge about legal proceedings, that doesn't work. But if you have all these things in place, you want to match it with the market and be good at marketing. And that is what we call the magic zone.
We cannot help you with a top things. That's where also you come in yourself where Reedsy and its services help you. We at K-Lytics can provide you with a map to the stars through our K-lytics database which covers every month updated, the complete data on all 7,000 genres category. And for those of you who are not into numbers, we take you by the hands in videos such as this one here and provide you with all the research in one specific genre.
The main thing is, the sky is really the limit. What you can do with words, sentences, your creativity, and with this market out there is still a huge opportunity. I think the story just begun for indie authors. The opportunities are still out there.


